Company Overview

Socket Mobile is a leading provider of data capture and delivery solutions, enhancing productivity for a mobile workforce through innovative technology and tailored applications. Historically, we began as a hardware peripheral company but have transitioned into a comprehensive data capture organization. Our evolution has enabled us to generate revenue through software solutions, as well as hardware solutions like barcode scanners and NFC/RFID readers. Initially building our foundation on hardware, we later expanded into software, creating a robust, integrated offering that covers all aspects of data capture for our customers.
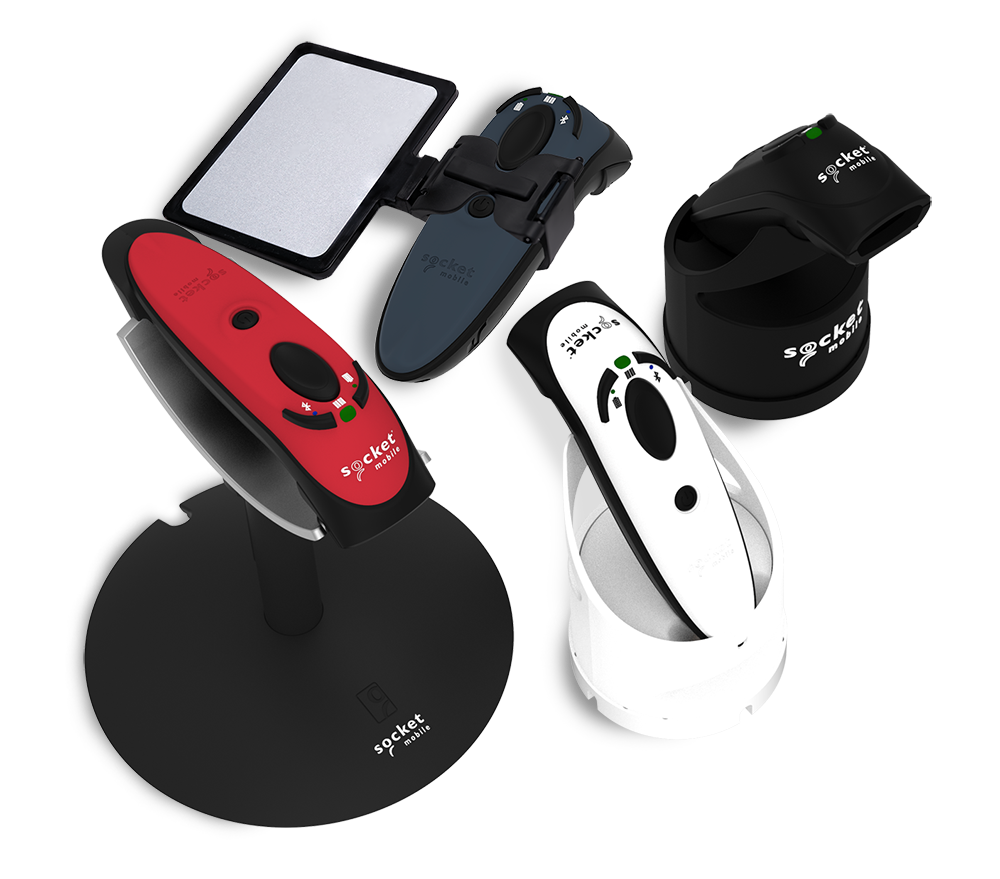
Our solutions are incorporated into mobile applications used in point of sale (POS), commercial services (field workers), asset tracking, manufacturing, and quality control processes, transportation and logistics (goods tracking and movement), event management (ticketing, entry, access control, and identification), medical and education. All products work with applications running on smartphones, mobile computers, and tablets using operating systems from Apple® (iOS), GoogleTM (AndroidTM), and Microsoft® (Windows®). We offer an easy-to-use software developer kit (CaptureSDK) to application developers, enabling them to provide their users with our advanced barcode scanning and NFC/RFID reader features.
Socket Mobile is headquartered in Fremont, CA, and can be reached at +1-510-933-3000 or www.socketmobile.com. Follow Socket Mobile on LinkedIn and X, and keep up with our latest News and Updates.
Socket Mobile company data (NASDAQ: SCKT)
Company information
Headquarters | Fremont, CA |
Founded | March 1992 |
Number of Employees | 52 |
Address
Socket Mobile, Inc.
40675 Encyclopedia Cir.
Fremont, California 94538
U.S.A.
Financial information
as of March 31, 2026
Last 12 Months Revenue | $14.8M |
Last 12 Months Gross Profit % | 49.9% |
Last 12 Months Loss | $(14.28M) |
Cash | $1.7M |
Total Assets | $13.9M |
Current Ratio | 0.96 |
Total Equity* | $3.5M |
Registered in the State of Delaware
Key metrics
Description | Quarterly | Annual | |||
Period | Q1 2026 | Q1 2025 | 2025 | 2024 | 2023 |
Profitable | No | No | No | No | No |
Positive Free Cash Flow | No | No | No | No | No |
Positive EBITDA | No | No | No | No | No |
Cash, end of period ($’000’s) | $1,710 | $1,707 | $2,032 | $2,492 | $2,827 |
Stockholders’ Equity end of period ($’000’s) | $3,549 | $17,237 | $4,279 | $18,160 | $19,420 |
Cordless Barcode Scanning – units sold | 14,172 | 15,374 | 65,771 | 70,840 | 74,779 |
Summary statements of operations
Derived from Audited and Unaudited Financial Statements
(Amounts in thousands except per share)
Description | Q1 2026 | 2025 | 2024 |
Revenue | $3,700 | $15,078 | $18,763 |
Gross Margin | $1,898 | $7,488 | $9,451 |
Gross Margin Percent | 51.3% | 49.7% | 50.4% |
Operating Expenses | $2,657 | $10,707 | $11,584 |
Operating Loss | $(760) | $(3,219) | $(2,463) |
Net Income (loss) | $(900) | $(14,379) | $(2,242) |
EBITDA | $(298) | $(1,220) | $(318) |
Net income (loss) per share - basic | $(0.11) | $(1.81) | $(0.30) |
Net income (loss) per share - fully diluted | $(0.11) | $(1.81) | $(0.30) |
Weighted Average Shares o/s basic | 8,136 | 7,925 | 7,558 |
Weighted Average Shares o/s fully diluted | 8,136 | 7,925 | 7,558 |